Exception Analytics Dashboard – KQL Queries
This document details a set of Kusto Query Language (KQL) queries used to analyze and visualize exception logs from Azure Application Insights. These queries break down exceptions by various dimensions — such as tenant, request path, program, or job name — to help monitor system health and troubleshoot issues effectively.
Note:
The Application Insights log queries in this section are applicable to deployments where Azure Application Insights is enabled (typically Azure-hosted environments).
📊 Tenant-wise Count of Exceptions in the Given Time Range
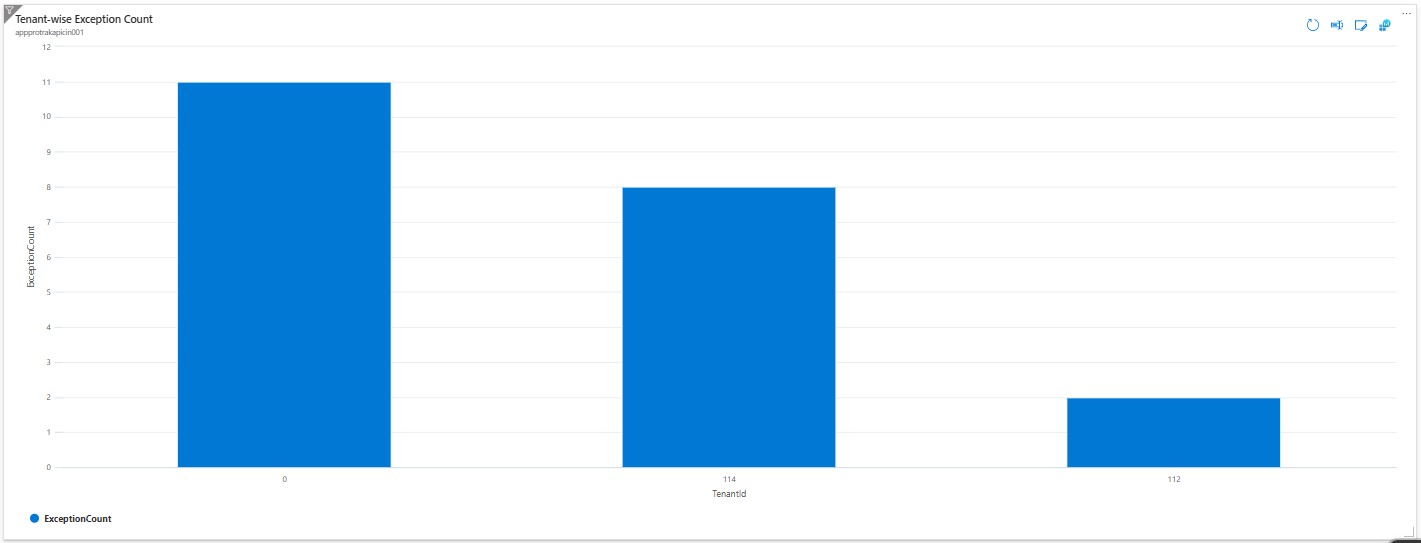
Title: Tenant-wise Exception Count
Query
exceptions
| where itemType == "exception" and isnotempty(customDimensions.TenantId)
| extend
    TenantId = tostring(customDimensions.TenantId)
| summarize ExceptionCount = count() by TenantId
| order by ExceptionCount desc
Description
Counts the number of exceptions per tenant within the selected time range. It filters exception logs containing a TenantId, groups results by TenantId, and summarizes the total exceptions for each. The chart orders tenants by exception count in descending order, highlighting which tenants face the most issues.
Chart Example:
📊 Exception Type Counts by Tenant in the Selected Time Range
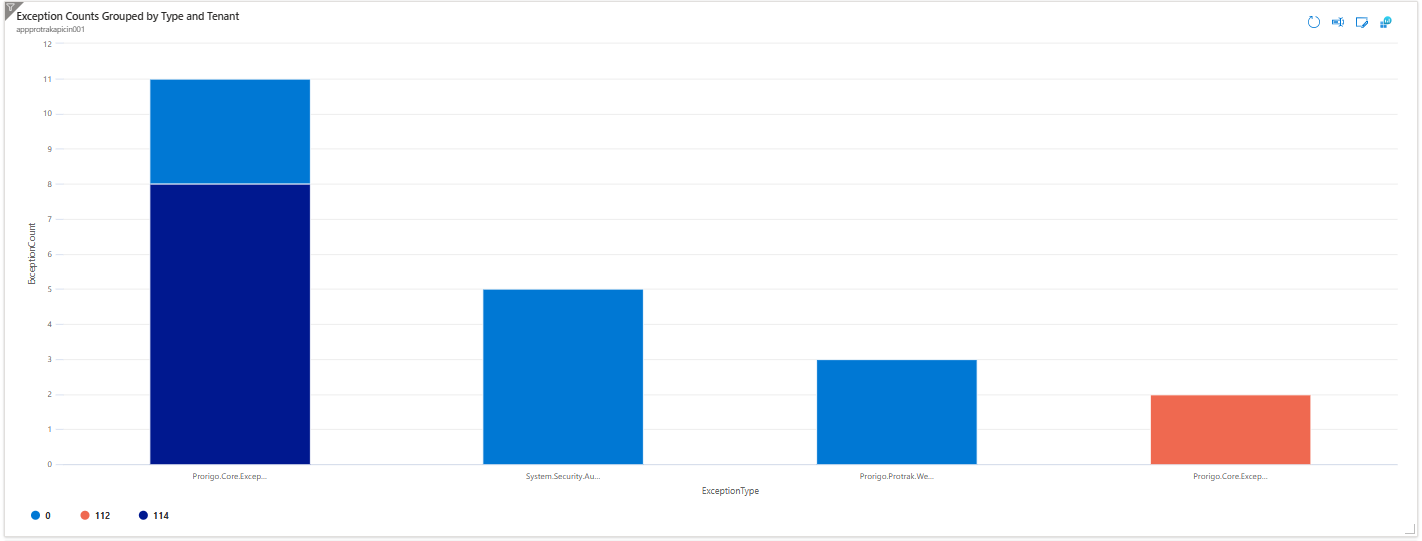
Title: Exception Counts Grouped by Type and Tenant
Query
exceptions
| where itemType == "exception"
    and isnotempty(customDimensions.TenantId)
| extend
    ExceptionType = type,
    TenantId = tostring(customDimensions.TenantId)
| summarize ExceptionCount = count() by ExceptionType, TenantId
| order by ExceptionCount desc
Description
Summarizes the total number of exceptions by both exception type and tenant ID within the selected time range. This helps identify the most frequent exception types and the tenants impacted, making it easier to prioritize troubleshooting efforts.
Chart Example:
📊 Count of Exceptions by Request Path / Async Job Name and Tenant in the Given Time Range
1️⃣ Exception Counts by API/Async Job Request Path and Tenant
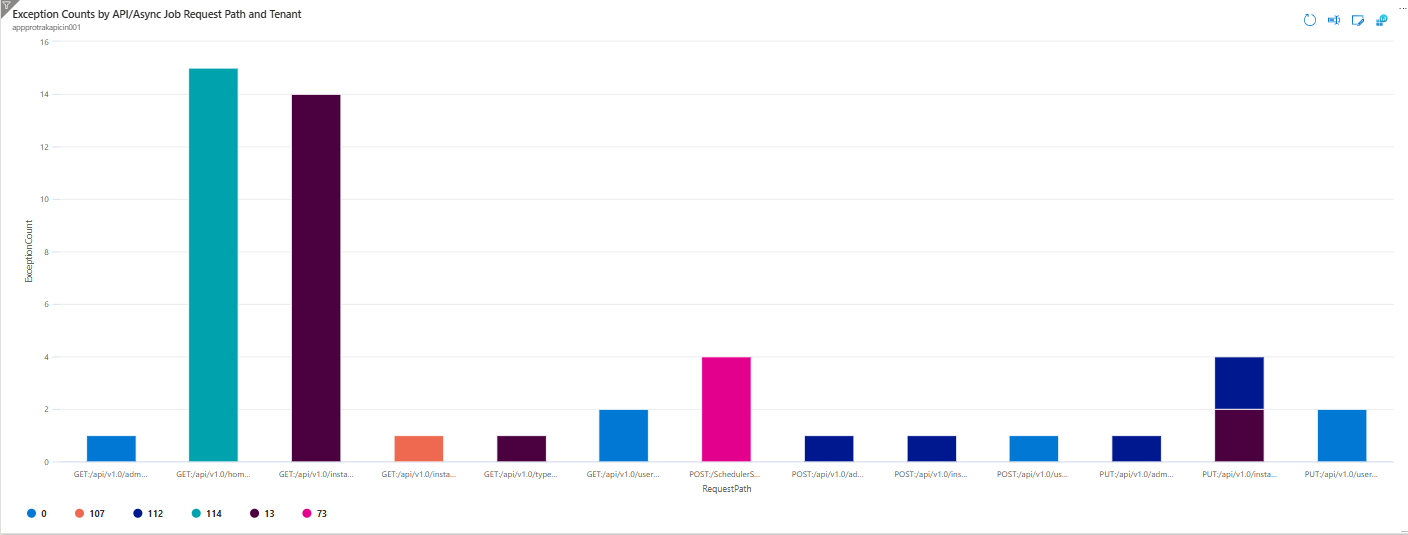
Title: Exception Counts by API/Async Job Request Path and Tenant
Query
exceptions
| where isnotempty(customDimensions.TenantId)
    and isnotempty(customDimensions.requestPath)
| extend
    RequestPath = strcat(tostring(customDimensions.requestMethod), ":", tostring(customDimensions.requestPath)),
    TenantId = tostring(customDimensions.TenantId)
| summarize ExceptionCount = count()
    by RequestPath, TenantId
| order by RequestPath asc, TenantId asc
| render columnchart
Description
Displays total exception counts grouped by both the API or Async Job request path and TenantId. It captures how many exceptions occurred for each unique combination of request path and tenant within the selected time range. The chart sorts results alphabetically by request path and tenant ID.
Chart Example:
2️⃣ API Service Exception Counts by Request Path and Tenant
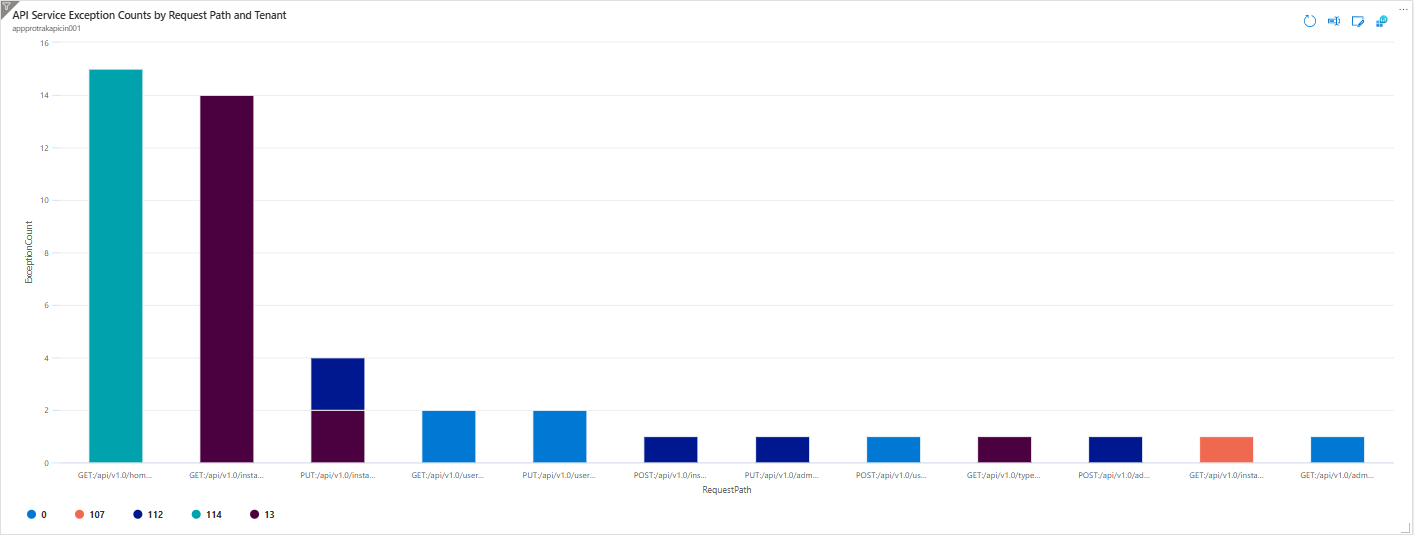
Title: API Service Exception Counts by Request Path and Tenant
Query
exceptions
| where isnotempty(customDimensions.TenantId)
    and isnotempty(customDimensions.requestPath)
    and tostring(customDimensions.requestPath) has "/api/v1.0"
| extend
    RequestPath = strcat(tostring(customDimensions.requestMethod), ":", tostring(customDimensions.requestPath)),
    TenantId = tostring(customDimensions.TenantId)
| summarize ExceptionCount = count()
    by RequestPath, TenantId
| order by ExceptionCount desc
Description
Presents total exceptions logged for REST API service request paths grouped by TenantId. It filters out GRPC requests and focuses on REST API exceptions. The query summarizes how many exceptions occurred for each request path and tenant, sorted by exception count in descending order.
Chart Example:
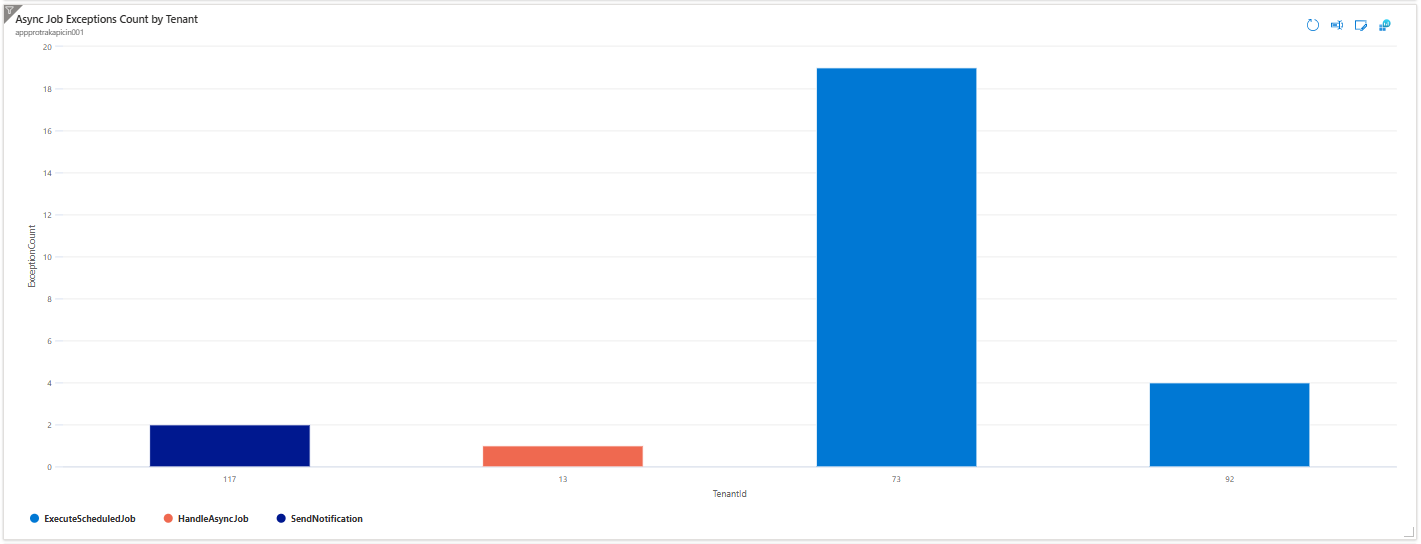
3️⃣ Async Job Exceptions Count by Tenant
Title: Async Job Exceptions Count by Tenant
Query
exceptions
| where isnotempty(customDimensions.TenantId)
    and tostring(customDimensions.requestPath) has "GRPC"
| extend
    TenantId = tostring(customDimensions.TenantId),
    AsyncJobName = tostring(split(tostring(customDimensions.requestPath), "/")[array_length(split(tostring(customDimensions.requestPath), "/")) - 1])
| summarize ExceptionCount = count()
    by TenantId, AsyncJobName
| order by TenantId asc, AsyncJobName asc
| render columnchart
Description
Visualizes exceptions triggered by asynchronous job executions (GRPC requests), grouped by TenantId and the extracted async job name from the request path. The chart displays exception counts for each tenant with bars split by async job name, helping identify frequently failing jobs and their affected tenants.
Chart Example:
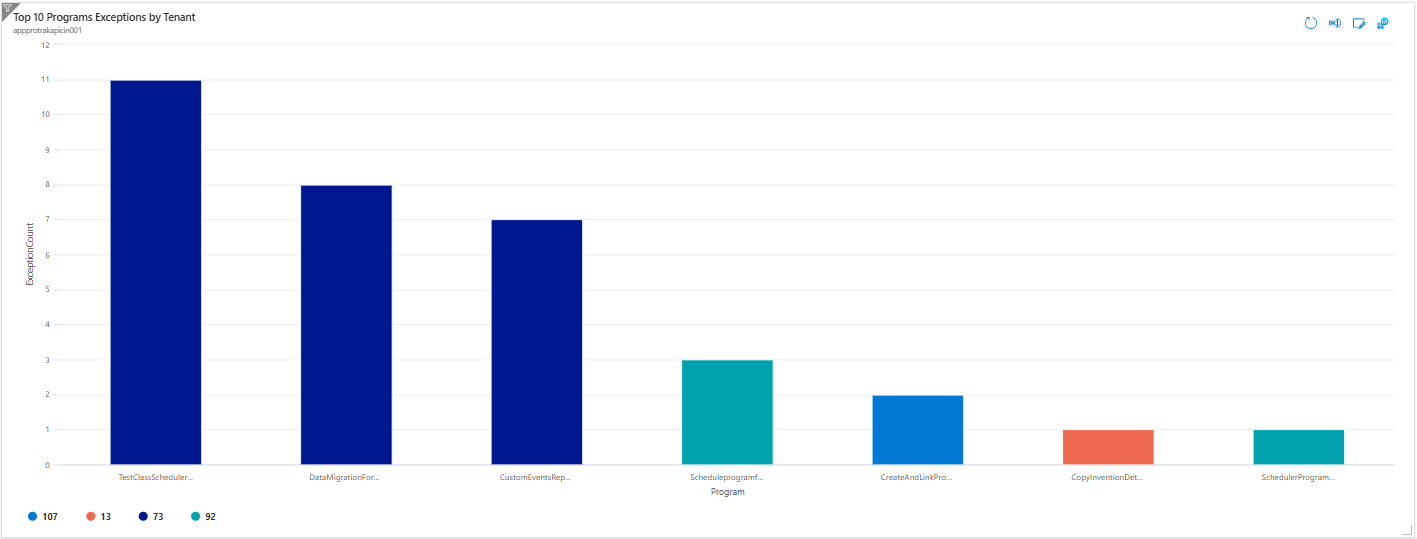
📊 Top 10 Programs Exceptions by Tenant in the Given Time Range
Title: Top 10 Programs Exceptions by Tenant
Query
exceptions
| where itemType == "exception"
    and isnotempty(customDimensions.TenantId)
    and isnotempty(customDimensions.programId)
| extend
    Program = strcat(tostring(customDimensions.programName), "-", tostring(customDimensions.programId)),
    TenantId = tostring(customDimensions.TenantId)
| summarize ExceptionCount = count() by Program, TenantId
| order by ExceptionCount desc
| top 10 by ExceptionCount
Description
Highlights the top 10 combinations of program and tenant IDs with the highest number of exceptions. It counts exceptions for each program-tenant pair and selects the top 10 by exception volume, enabling focused monitoring on the most error-prone program and tenant combinations.
Chart Example:
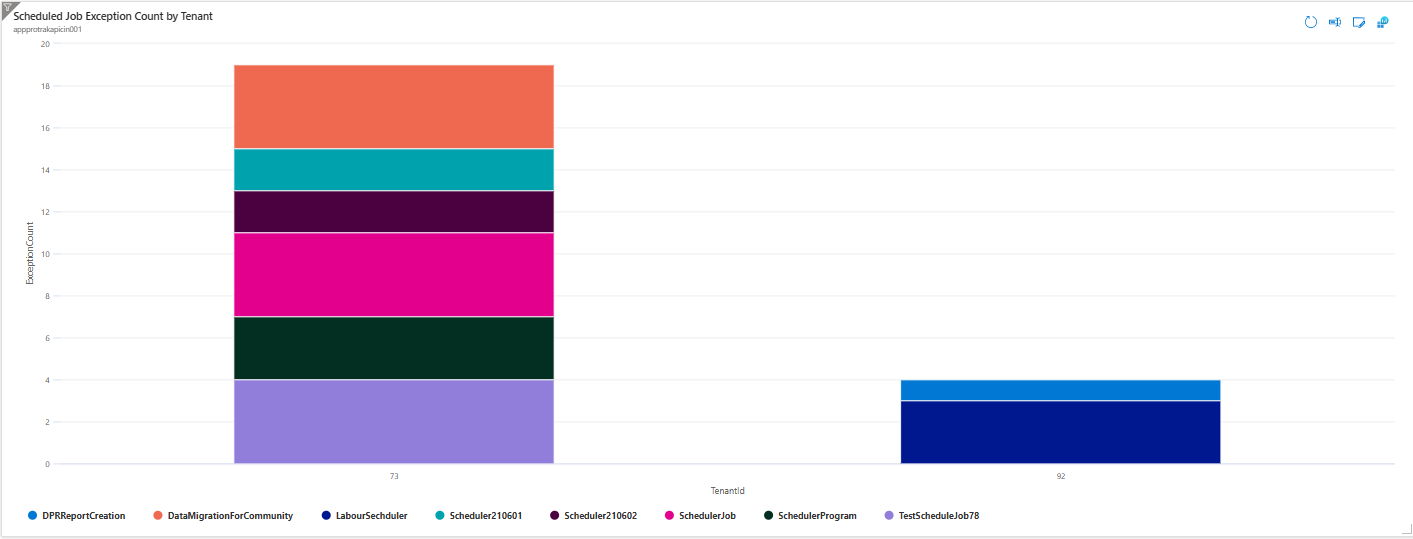
📊 Scheduled Job Exception Count by Tenant in the Given Time Range
Title: Scheduled Job Exception Count by Tenant
Query
exceptions
| where itemType == "exception"
    and isnotempty(customDimensions.TenantId)
    and tostring(customDimensions.requestPath) has "GRPC/ExecuteScheduledJob"
| extend
    TenantId = tostring(customDimensions.TenantId),
    SchedulerJobName = tostring(customDimensions.schedulerJobName)
| summarize ExceptionCount = count() by TenantId, SchedulerJobName
| order by TenantId asc, ExceptionCount desc
Description
Displays the number of exceptions generated by scheduled (GRPC-based) jobs, grouped by both TenantId and the scheduled job name. It counts exceptions for each job-tenant pair and orders results by tenant and then exception count in descending order, providing insight into job-specific issues per tenant.
Chart Example:
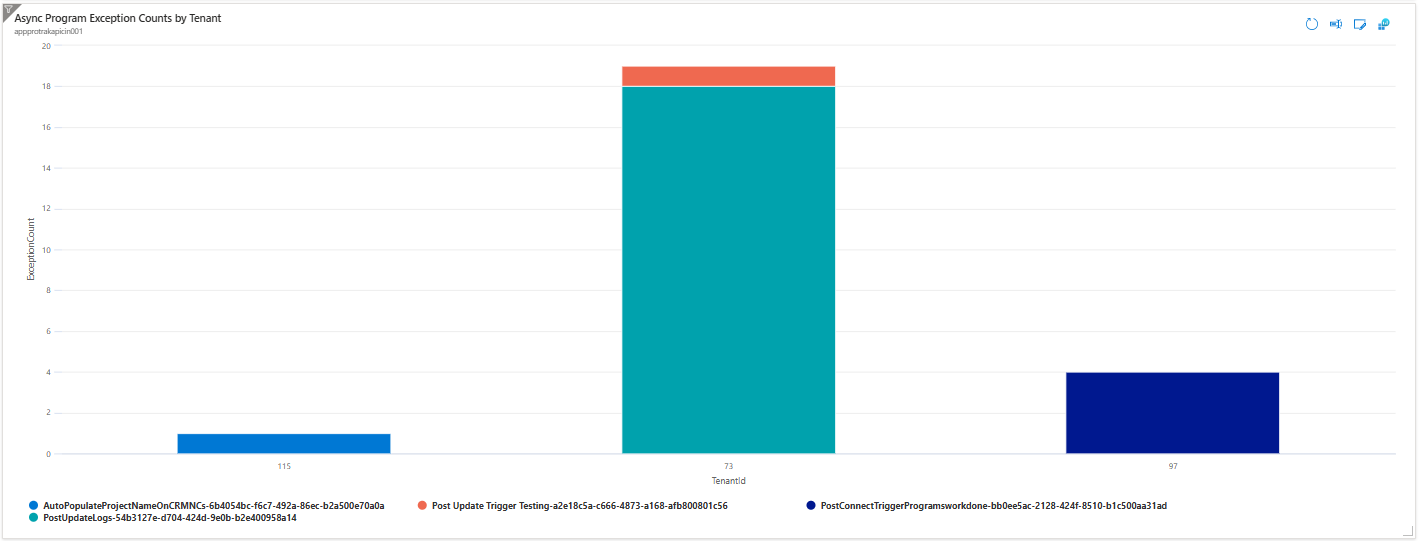
📊 Async Program Exception Counts by Tenant in the Given Time Range
Title: Async Program Exception Counts by Tenant
Query
exceptions
| where itemType == "exception"
    and isnotempty(customDimensions.TenantId)
    and isnotempty(customDimensions.programId)
    and tostring(customDimensions.requestPath) has "GRPC/HandleAsyncProgram"
| extend
    TenantId = tostring(customDimensions.TenantId),
    Program = strcat(tostring(customDimensions.programName), "-", tostring(customDimensions.programId))
| summarize ExceptionCount = count() by TenantId, Program
| order by TenantId asc, ExceptionCount desc
Description
Tracks exceptions from asynchronous programs, grouping results by both TenantId and program (a combination of program name and ID). It highlights which async programs encounter the most issues for each tenant, helping to quickly identify recurring problems by program and affected tenants.
Chart Example:
📌 Notes
- All queries are scoped to the selected time range in your dashboard.
- Adjust the dashboard time filter as needed to analyze different periods.